• Global CNC market projected to reach $128B by 2028 • New EU trade regulations for precision tooling components • Aerospace deman
NYSE: CNC +1.2%LME: STEEL -0.4%

How to verify low carbon footprint claims for CNC machines
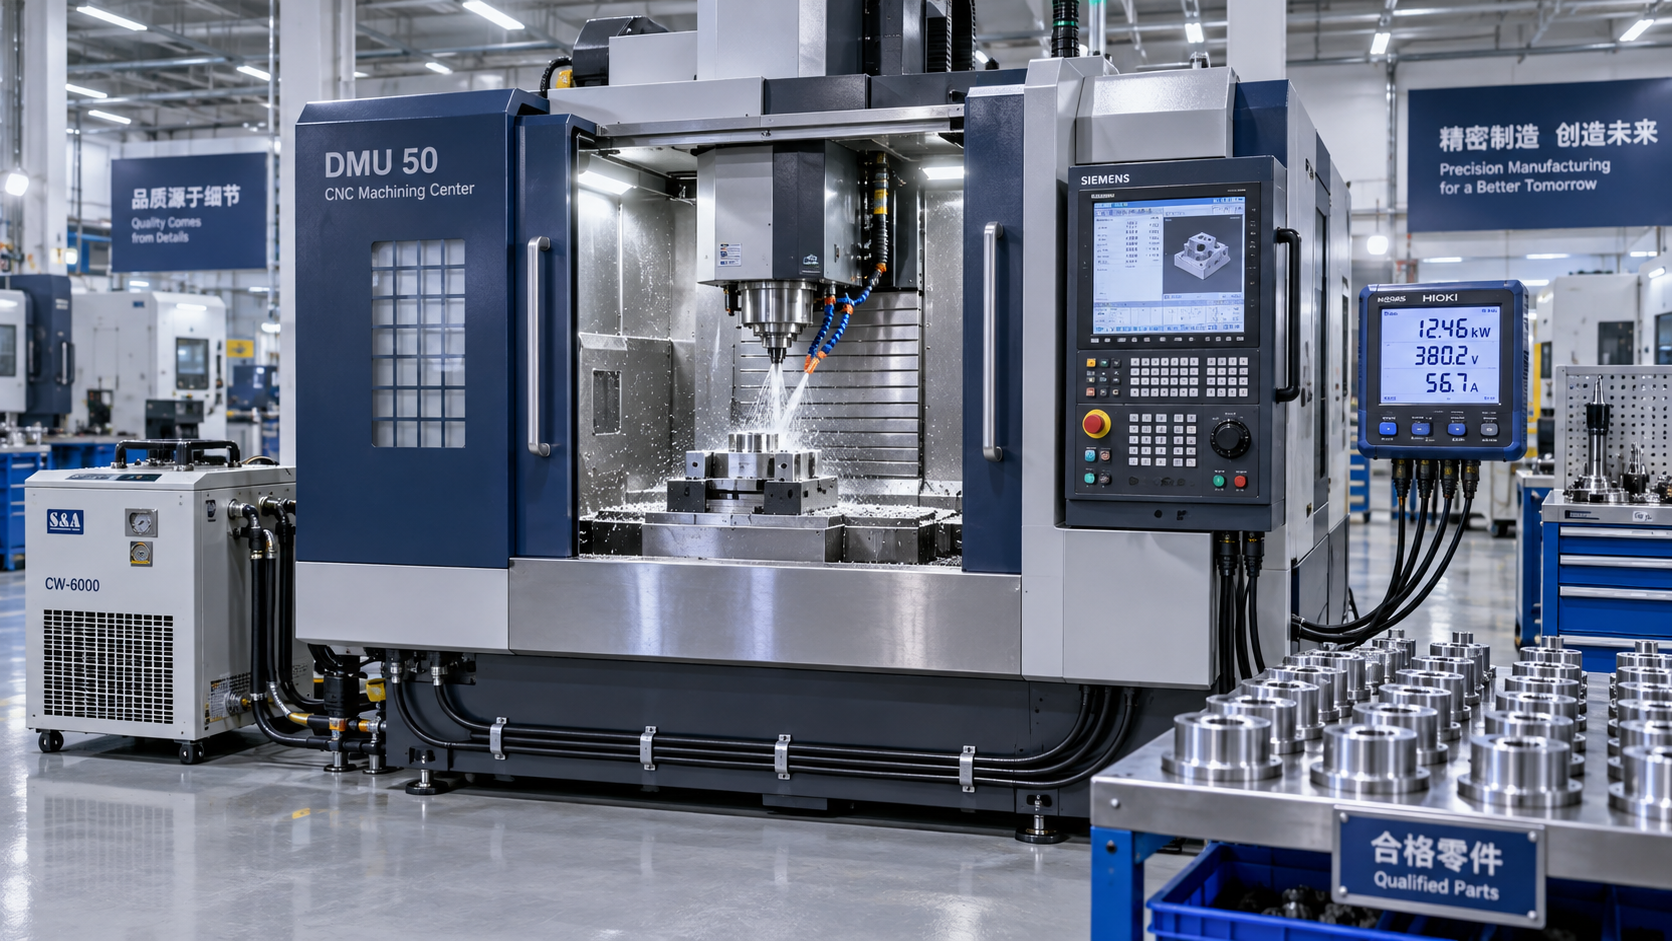
A CNC machine’s low carbon footprint claim is credible only when the supplier identifies what was measured, which lifecycle stages were included, and what production output the emissions represent. Rated spindle power, an energy-saving mode, or a percentage reduction in electricity use does not establish a lower product carbon footprint.
The decisive comparison is whether machines deliver the same manufacturing function with lower greenhouse gas emissions under comparable conditions. That requires separating the machine’s embodied emissions from operating emissions, checking the electricity assumptions, and measuring energy per conforming part rather than relying on power ratings or a favorable demonstration cycle.
Define the claim before examining the calculation
“Low carbon” is not a complete technical specification. A supplier could be referring to emissions from manufacturing the machine, electricity consumed during machining, or a lifecycle assessment covering manufacture, transport, operation, and end-of-life treatment. These claims require different evidence and cannot be compared interchangeably.
Request the exact claimed result in kilograms of carbon dioxide equivalent, or kg CO2e, together with its scope. For a reduction claim, the baseline must also be identifiable: a previous model, a competing machine, or the same machine operating without a particular control feature. A percentage without an absolute baseline conceals the size and relevance of the improvement.
The declared machine configuration matters. A bare machining center is not equivalent to one supplied with high-pressure coolant, a spindle chiller, mist extraction, a pallet system, and automated loading. The assessment should identify the model, installed options, software configuration, and equipment included within its boundary.
Keep the footprint of the machine distinct from the footprint of parts produced on it. A machine assessment may exclude workpiece material production, while a component assessment may find that material consumption and scrap significantly affect the result. Either boundary can answer a useful question, but the supplier must not switch between them when presenting an advantage.
Use standards to check the method—not as a substitute for evidence
Relevant standards address different parts of the verification problem. A reference to an ISO standard is useful only if the supporting report explains how its requirements were applied.
ISO 14955 is particularly relevant to checking machine-tool energy evidence. Ask which part and edition were used, how operating states were defined, and whether the test followed the stated measurement procedure. Energy measurements can support the operating stage of a carbon calculation, but they do not supply manufacturing emissions, electricity emission factors, or lifetime assumptions.
An environmental product declaration can provide structured disclosure, but it is not an environmental superiority certificate. Comparability depends on compatible product category rules, functional units, lifecycle boundaries, and scenarios. Similarly, an ISO 14001 certificate concerns an environmental management system; it does not verify the footprint of an individual machine.
Check whether the lifecycle boundary matches the claim
A cradle-to-gate assessment covers production up to a defined factory-gate boundary. It can support a claim about the machine’s embodied emissions, but not an unrestricted claim about its lifetime performance. A cradle-to-grave assessment extends the boundary through use and end-of-life treatment, with results dependent on the operating scenario.
For manufacturing emissions, inspect the basis for major material and component quantities: castings, steel fabrications, motors, drives, electronics, and other significant assemblies. The report should distinguish supplier-specific information from generic database estimates and explain exclusions. Missing information is not evidence of zero emissions.
For the use stage, examine assumed service life, annual operating hours, production mix, standby time, maintenance, and replacement components. Allocating embodied emissions across an optimistic lifetime output can make the result per part appear unusually favorable. Require both the total embodied footprint and the output used to allocate it.
Transport, installation, and end-of-life assumptions also need explicit treatment where they fall within scope. Recycling credits depend on the chosen allocation method and recovery scenario. A projected benefit from future recycling should not be mistaken for a measured reduction in present manufacturing emissions.
A full lifecycle claim should therefore be accompanied by results broken down by stage. This reveals whether the reported advantage comes from measured machine efficiency, lower-emission manufacturing, or assumptions about future operation and disposal.
Measure the complete production cycle, not just cutting power
The electrical input to a CNC machine supplies more than the spindle. Axis drives, hydraulic systems, coolant pumps, chillers, controls, lubrication, chip handling, and extraction equipment can consume energy outside active cutting. Lower spindle power alone may therefore produce little improvement in total electricity per finished part.
A defensible test records energy across operating states relevant to the intended production schedule:
- Startup and thermal stabilization.
- Ready or idle operation between cycles.
- Machining, including tool changes and programmed pauses.
- Part loading, unloading, and inspection-related delays.
- Standby and shutdown periods.
The test duration must capture recurring auxiliary loads. A short measurement can miss a chiller cycle or hydraulic accumulator recharge and understate consumption. Measurement intervals must also be appropriate to the load changes being assessed.
Use a calibrated meter capable of measuring real electrical energy at the relevant supply point. Nameplate ratings and current readings alone are not sufficient substitutes. Controller-reported energy can be useful, but its coverage and accuracy should be checked against an appropriate external measurement.
Document what sits outside the measurement point. Central compressed air, shared coolant systems, external chillers, robots, and extraction equipment can otherwise disappear from the calculation. Where shared utilities are allocated, the allocation method should be stated. Compressed air consumption, for example, requires an energy conversion based on the supply system—not an assumption that air is carbon-free.
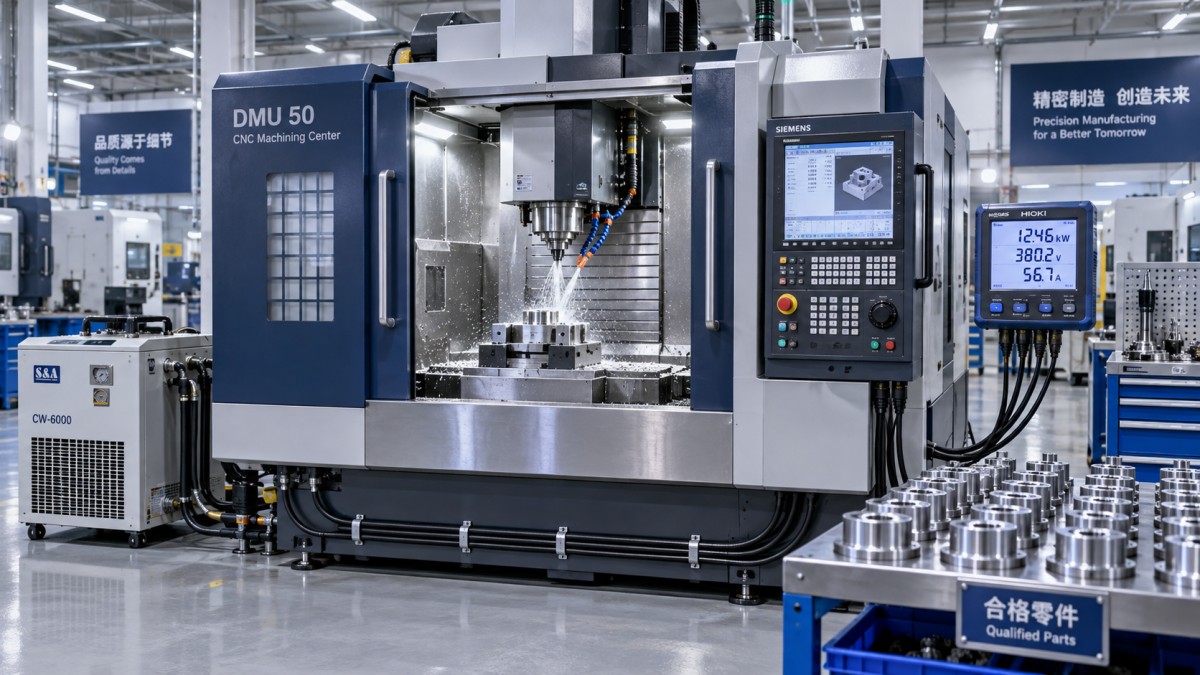
Machine-level metering and production-cell metering answer different questions. The former helps isolate machine behavior; the latter can establish whether a claimed saving survives once necessary supporting equipment is included. Both can be valuable, provided their boundaries remain explicit.
Normalize results to conforming output
For a defined production operation, a useful operational metric is:
Operational electricity emissions per conforming part = total electricity consumed within the test boundary × applicable electricity emission factor ÷ number of conforming parts produced.
Use total energy over a representative production period rather than energy from a selected successful cycle. Include rejected parts, rework, warm-up, and other loads that belong to the agreed production boundary. A machine that consumes less electricity per cycle but produces more rejects may have a worse result per accepted component.
The manufacturing function must also match. Compare the same material grade, starting-stock condition, drawing requirements, tolerances, surface finish, and inspection criteria. Tooling, cutting parameters, coolant settings, and batch size should be recorded. Identical cutting parameters can help isolate equipment differences, while optimized parameters can compare achievable production performance. These are different tests and should be described accordingly.
Consider an illustrative comparison, not measured machine data. Machine A consumes 4 kWh per cycle and yields 95 conforming parts per 100 cycles. Machine B consumes 4.2 kWh per cycle and yields 99 conforming parts. Ignoring other loads, their electricity consumption is approximately 4.21 and 4.24 kWh per conforming part, respectively. A 5% cycle-energy difference becomes a much smaller difference after yield normalization.
Cycle time also affects interpretation. Higher instantaneous power can coexist with lower energy per part if machining finishes sooner. Conversely, an energy-saving mode that slows production can extend auxiliary operating time or require additional capacity. Check that the tested process still meets the required throughput and quality.
Separate machine efficiency from electricity sourcing
Electricity consumption and carbon emissions are related, but they are not interchangeable. Identical machines can have different operating footprints at sites with different electricity supplies. A supplier’s low-carbon result calculated for one location may not represent operation at the destination factory.
Request the emission factor’s source, geography, reference period, units, and accounting basis. Check whether it covers electricity generation alone or also includes upstream lifecycle emissions, and apply a consistent basis across candidates.
Contractual renewable-electricity claims need separate scrutiny. Where contractual instruments are used, examine the accounting rules and supporting evidence, and do not silently compare that result with another machine calculated using a grid-average factor. A contractual sourcing benefit does not demonstrate lower electricity consumption by the equipment.
For technical comparison, report kWh per conforming part separately and recalculate operating emissions using a common destination-site factor. Keep manufacturing-stage electricity assumptions separate: the energy supply used to build the machine and the supply used to operate it belong to different lifecycle stages.
Carbon offsets should also be disclosed separately from the gross footprint. Compensation does not reduce the machine’s measured energy demand or its calculated lifecycle emissions before offsets.
Inspect the verification scope and test whether the advantage is robust
Independent review is meaningful only when its scope matches the claim. Obtain the verification statement alongside the assessment report or a sufficiently detailed technical summary. Check the verifier’s identity, independence, criteria, assurance level where applicable, exclusions, and the model or product family covered.
A verified factory emissions inventory is not equivalent to a verified machine footprint. Verification of manufacturing-stage data does not validate a projected twenty-year operating scenario. Likewise, a family-level assessment may not substantiate an option-heavy configuration without an explained adjustment method.
The evidence package should allow the result to be traced from source data to the published figure: measured energy records, test conditions, material inventories, emission factors, allocation rules, and calculation versions. Confidentiality can justify controlled access to detailed information, but it does not make an unsupported headline independently verifiable.
Finally, examine sensitivity to variables that could change the ranking: annual utilization, standby share, service life, electricity carbon intensity, yield, and major component replacement. Measurement repeatability and uncertainty should be reported. If a small claimed advantage disappears within plausible uncertainty or under the intended production schedule, the evidence does not support a clear winner.
The strongest low carbon footprint CNC machines claims remain credible after the numbers are recalculated for the actual configuration, destination electricity supply, required quality, and expected workload. Where that recalculation is impossible, restrict the conclusion to what the evidence proves—for example, lower measured electricity consumption in a defined test—rather than accepting an unrestricted lifecycle claim.
PREVIOUS ARTICLE
Recommended for You
![]() Mitsubishi Electric Announces Physical AI System Linking Humanoid Robots and CNC MachinesMachine Tool Industry Editorial Team
 Precision Machining for Defense: Supplier Quality and Traceability ChecksManufacturing Market Research Center
![]() Nidec Machine Tool Launches MVR-5X Five-Axis Gantry MachineMachine Tool Industry Editorial Team
 Choosing a Precision Disc Parts Manufacturer in China: Tolerances and Quality ChecksManufacturing Market Research Center
![]() Siemens Executive Says AI Could Raise Factory Automation to 80%Manufacturing Market Research Center
 Choosing Automated Machine Tools for High-Mix, Low-Volume ProductionMachine Tool Industry Editorial Team


Aris Katos
Future of Carbide Coatings
15+ years in precision manufacturing systems. Specialized in high-speed milling and aerospace grade alloy processing.
▶
How to compare CNC machines by their lifetime carbon footprintManufacturing Policy Research Center▶
How to verify low carbon footprint claims for CNC machinesManufacturing Policy Research Center▶
EU REACH Adds Limits on Nanomaterial Cutting Fluid AdditivesManufacturing Policy Research Center▶
Energy-Saving CNC Manufacturing: Which Upgrades Deliver the Best ROI?Manufacturing Policy Research Center▶
Vietnam Requires ISO 50001 Proof for Imported CNC MachinesManufacturing Policy Research Center
▶
Mastering 5-Axis Workholding Strategies
Join our technical panel on Nov 15th to learn about reducing vibrations in thin-wall components.

Providing you with integrated sanding solutions
Before-sales and after-sales services
Comprehensive technical support